Same pay, different telework ability: what BLS data shows for 208 occupations
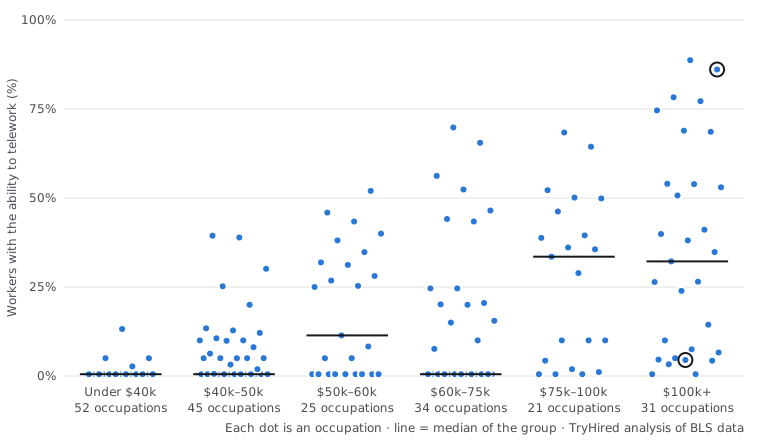
Across 208 U.S. occupations, higher-paying jobs tend to have more workers with the ability to telework, but occupations with nearly the same median pay can differ by 50 percentage points or more.
What the data shows
Data Each finding is computed from the CSV below; the exact computation is in findings.json.
- Across 208 U.S. occupations, those with higher median pay tend to have a larger share of workers with the ability to telework: the Spearman rank correlation is 0.60 (95% bootstrap interval 0.52 to 0.69), based on BLS Occupational Requirements Survey 2025 preliminary estimates and OEWS May 2025 wages.S1-F1
- The relationship holds however the published ranges are treated: placing every BLS range at its upper bound, its midpoint or zero gives a rank correlation of 0.57 to 0.61 across the same 208 occupations (ORS 2025 preliminary, OEWS May 2025).S1-F2
- In 51 of the 52 occupations with a national median wage under $40,000 in May 2025, BLS estimates that fewer than 5% of workers had the ability to telework (ORS 2025 preliminary).S1-F3
- Higher pay does not settle it: of the 31 occupations with a national median wage of $100,000 or more (OEWS May 2025), 11 had at least half of workers with the ability to telework, while 8 had fewer than 5% (BLS ORS 2025 preliminary).S1-F4
- Education administrators, kindergarten through secondary (national median $105,870) and computer systems analysts ($105,850) earn within $20 a year of each other, yet BLS estimates that 4.5% of workers in the first occupation and 86.1% in the second had the ability to telework (OEWS May 2025; ORS 2025 preliminary).S1-F5
- TryHired found 12 pairs of occupations whose national median wages are within 3% of each other but whose shares of workers with the ability to telework differ by 50 percentage points or more (OEWS May 2025; ORS 2025 preliminary point estimates).S1-F6
- For 103 of the 208 occupations, BLS publishes the share of workers with the ability to telework only as less than 0.5% (ORS 2025 preliminary); 48 of them have a national median wage under $40,000 (OEWS May 2025).S1-F7
Every occupation, by pay band
Data BLS publishes many low shares only as ranges (for example less than 0.5%); those dots sit just below the published bound.
| Pay band (national median) | Occupations | Median occupation | Middle half | Below 5% (definitely) | Below 5% (unknown: range) | 50% or more |
|---|---|---|---|---|---|---|
| Under $40k | 52 | 0.5% | 0.5–0.5% | 51 | 0 | 0 |
| $40k–50k | 45 | 0.5% | 0.5–9.9% | 31 | 3 | 0 |
| $50k–60k | 25 | 11.4% | 0.5–31.9% | 11 | 2 | 1 |
| $60k–75k | 34 | 0.5% | 0.5–24.6% | 18 | 3 | 4 |
| $75k–100k | 21 | 33.5% | 4.3–46.2% | 6 | 2 | 4 |
| $100k+ | 31 | 32.2% | 5–54% | 8 | 1 | 11 |
Occupations that pay about the same
All 12 pairs of occupations (ORS point estimates only) whose national medians are within 3% of each other and whose telework ability differs by 50 points or more.
| Occupation | Median pay | Telework ability | Occupation | Median pay | Telework ability |
|---|---|---|---|---|---|
| Librarians and media collections specialists | $68,270 | 7.6% | Training and development specialists | $69,280 | 69.8% |
| First-line supervisors of mechanics, installers, and repairers | $79,860 | 1.9% | Compliance officers | $80,730 | 64.4% |
| Registered nurses | $97,550 | 1.1% | Network and computer systems administrators | $99,130 | 52.2% |
| Management analysts | $101,860 | 74.6% | Industrial engineers | $102,440 | 6.6% |
| Industrial engineers | $102,440 | 6.6% | Financial and investment analysts | $102,740 | 78.3% |
| Financial and investment analysts | $102,740 | 78.3% | General and operations managers | $105,770 | 26.5% |
| Education administrators, postsecondary | $104,590 | 32.2% | Computer systems analysts | $105,850 | 86.1% |
| General and operations managers | $105,770 | 26.5% | Computer systems analysts | $105,850 | 86.1% |
| Computer systems analysts | $105,850 | 86.1% | Education administrators, kindergarten through secondary | $105,870 | 4.5% |
| Computer systems analysts | $105,850 | 86.1% | Facilities managers | $106,660 | 7.5% |
| Computer systems analysts | $105,850 | 86.1% | Transportation, storage, and distribution managers | $107,230 | 14.4% |
| Nurse practitioners | $132,300 | 3.3% | Software developers | $135,980 | 77.2% |
All 208 occupations (table view of every dot)
| Occupation | SOC | Median annual wage | Employment | Telework ability |
|---|---|---|---|---|
| Architectural and engineering managers | 11-9041 | $171,270 | 220,260 | 53% |
| Marketing managers | 11-2021 | $166,790 | 395,240 | 88.7% |
| Financial managers | 11-3031 | $166,570 | 841,710 | 41.1% |
| Lawyers | 23-1011 | $159,670 | 754,500 | 68.6% |
| Human resources managers | 11-3121 | $149,280 | 220,660 | 54% |
| Sales managers | 11-2022 | $148,270 | 637,080 | 68.9% |
| Purchasing managers | 11-3061 | $148,080 | 84,320 | 26.4% |
| Managers, all other | 11-9199 | $141,900 | 622,190 | 34.8% |
| Pharmacists | 29-1051 | $140,910 | 321,970 | less than 0.5% |
| Software developers | 15-1252 | $135,980 | 1,687,890 | 77.2% |
| Physician assistants | 29-1071 | $135,880 | 162,150 | less than 5% |
| Nurse practitioners | 29-1171 | $132,300 | 323,040 | 3.3% |
| Industrial production managers | 11-3051 | $126,060 | 246,250 | 4.6% |
| Medical and health services managers | 11-9111 | $123,860 | 597,080 | 23.9% |
| Construction managers | 11-9021 | $114,990 | 380,360 | 4.3% |
| Administrative services managers | 11-3012 | $114,130 | 263,960 | 38.1% |
| Transportation, storage, and distribution managers | 11-3071 | $107,230 | 221,180 | 14.4% |
| Facilities managers | 11-3013 | $106,660 | 156,180 | 7.5% |
| First-line supervisors of police and detectives | 33-1012 | $106,040 | 154,610 | less than 5% |
| Education administrators, kindergarten through secondary | 11-9032 | $105,870 | 328,330 | 4.5% |
| Computer systems analysts | 15-1211 | $105,850 | 519,530 | 86.1% |
| General and operations managers | 11-1021 | $105,770 | 3,503,020 | 26.5% |
| Sales representatives, wholesale and manufacturing, technical and scientific products | 41-4011 | $104,920 | 284,800 | 50.7% |
| Education administrators, postsecondary | 11-9033 | $104,590 | 180,470 | 32.2% |
| Mechanical engineers | 17-2141 | $104,110 | 296,810 | 39.9% |
| Physical therapists | 29-1123 | $102,760 | 267,330 | less than 10% |
| Financial and investment analysts | 13-2051 | $102,740 | 361,980 | 78.3% |
| Industrial engineers | 17-2112 | $102,440 | 365,740 | 6.6% |
| Project management specialists | 13-1082 | $102,320 | 1,066,670 | 53.9% |
| Management analysts | 13-1111 | $101,860 | 898,280 | 74.6% |
| Occupational therapists | 29-1122 | $100,330 | 162,450 | less than 0.5% |
| Network and computer systems administrators | 15-1244 | $99,130 | 314,340 | 52.2% |
| Dental hygienists | 29-1292 | $98,100 | 222,740 | less than 0.5% |
| Speech-language pathologists | 29-1127 | $97,870 | 183,390 | 4.3% |
| Registered nurses | 29-1141 | $97,550 | 3,379,720 | 1.1% |
| First-line supervisors of fire fighting and prevention workers | 33-1021 | $93,530 | 99,140 | less than 10% |
| Occupational health and safety specialists | 19-5011 | $90,150 | 140,610 | 10% |
| Accountants and auditors | 13-2011 | $83,680 | 1,449,500 | 68.4% |
| Compliance officers | 13-1041 | $80,730 | 417,070 | 64.4% |
| Social and community service managers | 11-9151 | $80,390 | 209,330 | 28.9% |
| First-line supervisors of construction trades and extraction workers | 47-1011 | $79,920 | 812,210 | less than 10% |
| Aircraft mechanics and service technicians | 49-3011 | $79,870 | 138,090 | less than 0.5% |
| First-line supervisors of mechanics, installers, and repairers | 49-1011 | $79,860 | 617,500 | 1.9% |
| Market research analysts and marketing specialists | 13-1161 | $78,760 | 899,580 | 36.1% |
| Cost estimators | 13-1051 | $78,740 | 224,220 | 35.6% |
| Compensation, benefits, and job analysis specialists | 13-1141 | $78,210 | 112,380 | 49.9% |
| Instructional coordinators | 25-9031 | $77,440 | 227,760 | 38.8% |
| Loan officers | 13-2072 | $76,690 | 274,330 | 46.2% |
| Executive secretaries and executive administrative assistants | 43-6011 | $76,590 | 459,910 | 39.5% |
| Computer network support specialists | 15-1231 | $76,220 | 146,190 | 33.5% |
| Police and sheriff's patrol officers | 33-3051 | $76,210 | 670,520 | less than 0.5% |
| Human resources specialists | 13-1071 | $75,940 | 912,430 | 50.1% |
| Construction and building inspectors | 47-4011 | $74,690 | 146,720 | less than 20% |
| First-line supervisors of production and operating workers | 51-1011 | $74,450 | 673,430 | less than 0.5% |
| Special education teachers, secondary school | 25-2058 | $74,260 | 163,930 | less than 0.5% |
| Fundraisers | 13-1131 | $72,550 | 111,040 | 65.5% |
| Sales representatives, wholesale and manufacturing, except technical and scientific products | 41-4012 | $72,080 | 1,238,190 | 56.2% |
| Secondary school teachers, except special and career/technical education | 25-2031 | $72,040 | 1,065,210 | less than 0.5% |
| Mechanical drafters | 17-3013 | $71,550 | 39,960 | 20.5% |
| Property, real estate, and community association managers | 11-9141 | $69,990 | 311,180 | 20.1% |
| Sales representatives of services, except advertising, insurance, financial services, and travel | 41-3091 | $69,990 | 1,256,010 | 43.4% |
| First-line supervisors of office and administrative support workers | 43-1011 | $69,500 | 1,436,680 | 24.6% |
| Food service managers | 11-9051 | $69,390 | 238,430 | less than 15% |
| Training and development specialists | 13-1151 | $69,280 | 458,300 | 69.8% |
| Lodging managers | 11-9081 | $69,250 | 42,620 | 24.6% |
| Physical therapist assistants | 31-2021 | $68,380 | 112,430 | less than 0.5% |
| Librarians and media collections specialists | 25-4022 | $68,270 | 133,790 | 7.6% |
| Healthcare social workers | 21-1022 | $67,880 | 187,630 | 44.1% |
| Special education teachers, middle school | 25-2057 | $66,810 | 95,200 | less than 0.5% |
| Probation officers and correctional treatment specialists | 21-1092 | $66,270 | 89,390 | less than 10% |
| Industrial machinery mechanics | 49-9041 | $64,520 | 439,640 | less than 0.5% |
| Licensed practical and licensed vocational nurses | 29-2061 | $64,400 | 648,410 | less than 0.5% |
| Middle school teachers, except special and career/technical education | 25-2022 | $64,370 | 620,090 | less than 0.5% |
| Educational, guidance, and career counselors and advisors | 21-1012 | $64,330 | 353,310 | 15.5% |
| Elementary school teachers, except special education | 25-2021 | $63,970 | 1,388,390 | less than 0.5% |
| Plumbers, pipefitters, and steamfitters | 47-2152 | $63,800 | 465,840 | less than 0.5% |
| Electricians | 47-2111 | $63,190 | 757,220 | less than 0.5% |
| Paralegals and legal assistants | 23-2011 | $62,890 | 392,880 | 46.5% |
| Kindergarten teachers, except special education | 25-2012 | $62,680 | 108,870 | less than 0.5% |
| Chefs and head cooks | 35-1011 | $62,470 | 200,040 | less than 0.5% |
| Computer user support specialists | 15-1232 | $61,860 | 717,190 | 52.4% |
| Bus and truck mechanics and diesel engine specialists | 49-3031 | $61,770 | 289,960 | less than 0.5% |
| Heating, air conditioning, and refrigeration mechanics and installers | 49-9021 | $61,010 | 409,670 | less than 0.5% |
| Maintenance workers, machinery | 49-9043 | $60,850 | 60,020 | less than 0.5% |
| Carpenters | 47-2031 | $60,580 | 670,090 | less than 0.5% |
| Water and wastewater treatment plant and system operators | 51-8031 | $60,020 | 128,490 | less than 0.5% |
| Operating engineers and other construction equipment operators | 47-2073 | $59,850 | 478,090 | less than 0.5% |
| Production, planning, and expediting clerks | 43-5061 | $59,650 | 390,160 | 11.4% |
| Child, family, and school social workers | 21-1021 | $59,550 | 392,550 | 52% |
| Education and childcare administrators, preschool and daycare | 11-9031 | $59,300 | 73,660 | less than 5% |
| Firefighters | 33-2011 | $59,280 | 345,990 | less than 0.5% |
| Correctional officers and jailers | 33-3012 | $58,940 | 380,500 | less than 0.5% |
| Heavy and tractor-trailer truck drivers | 53-3032 | $58,640 | 2,062,040 | less than 0.5% |
| First-line supervisors of landscaping, lawn service, and groundskeeping workers | 37-1012 | $58,430 | 130,760 | less than 5% |
| Payroll and timekeeping clerks | 43-3051 | $58,260 | 153,140 | 34.8% |
| Audio and video technicians | 27-4011 | $58,100 | 70,230 | less than 40% |
| First-line supervisors of security workers | 33-1091 | $55,940 | 81,480 | less than 0.5% |
| Legal secretaries and administrative assistants | 43-6012 | $55,570 | 156,280 | 38.1% |
| Eligibility interviewers, government programs | 43-4061 | $54,210 | 154,800 | 31.9% |
| Welders, cutters, solderers, and brazers | 51-4121 | $53,750 | 416,210 | less than 0.5% |
| Public safety telecommunicators | 43-5031 | $53,040 | 102,500 | less than 0.5% |
| Cargo and freight agents | 43-5011 | $52,260 | 97,670 | 25.3% |
| Community health workers | 21-1094 | $51,850 | 61,660 | 45.9% |
| Medical records specialists | 29-2072 | $51,140 | 194,720 | 43.4% |
| Bookkeeping, accounting, and auditing clerks | 43-3031 | $50,670 | 1,373,680 | 28.1% |
| Automotive service technicians and mechanics | 49-3023 | $50,620 | 704,640 | less than 0.5% |
| Human resources assistants, except payroll and timekeeping | 43-4161 | $50,610 | 90,220 | 26.8% |
| Procurement clerks | 43-3061 | $50,580 | 55,810 | less than 25% |
| Dispatchers, except police, fire, and ambulance | 43-5032 | $50,340 | 202,810 | 8.3% |
| Highway maintenance workers | 47-4051 | $50,260 | 154,960 | less than 0.5% |
| Loan interviewers and clerks | 43-4131 | $50,020 | 164,790 | 31.2% |
| Refuse and recyclable material collectors | 53-7081 | $49,690 | 147,240 | less than 0.5% |
| Maintenance and repair workers, general | 49-9071 | $49,590 | 1,529,700 | less than 0.5% |
| Information and record clerks, all other | 43-4199 | $49,500 | 134,920 | less than 5% |
| First-line supervisors of housekeeping and janitorial workers | 37-1011 | $49,100 | 178,760 | less than 20% |
| Court, municipal, and license clerks | 43-4031 | $48,700 | 179,750 | 6.3% |
| First-line supervisors of personal service workers | 39-1022 | $48,590 | 114,110 | 8.1% |
| Inspectors, testers, sorters, samplers, and weighers | 51-9061 | $48,570 | 597,370 | less than 0.5% |
| First-line supervisors of entertainment and recreation workers, except gambling services | 39-1014 | $48,560 | 103,190 | less than 5% |
| First-line supervisors of retail sales workers | 41-1011 | $48,520 | 1,121,800 | 1.9% |
| Billing and posting clerks | 43-3021 | $48,500 | 404,060 | 39.4% |
| Coating, painting, and spraying machine setters, operators, and tenders | 51-9124 | $48,250 | 158,740 | less than 0.5% |
| Dental assistants | 31-9091 | $48,070 | 387,790 | less than 0.5% |
| Bus drivers, school | 53-3051 | $47,920 | 402,930 | less than 0.5% |
| New accounts clerks | 43-4141 | $47,670 | 36,860 | less than 10% |
| Secretaries and administrative assistants, except legal, medical, and executive | 43-6014 | $47,540 | 1,706,790 | 25.2% |
| Veterinary technologists and technicians | 29-2056 | $47,380 | 129,140 | less than 5% |
| Coaches and scouts | 27-2022 | $47,320 | 248,950 | less than 0.5% |
| Opticians, dispensing | 29-2081 | $47,260 | 73,530 | less than 0.5% |
| Exercise trainers and group fitness instructors | 39-9031 | $47,160 | 322,930 | less than 0.5% |
| Construction laborers | 47-2061 | $47,120 | 1,096,780 | less than 0.5% |
| Industrial truck and tractor operators | 53-7051 | $46,420 | 774,420 | less than 0.5% |
| Order clerks | 43-4151 | $46,170 | 75,200 | 9.9% |
| Social and human service assistants | 21-1093 | $45,930 | 437,860 | 30.1% |
| Medical secretaries and administrative assistants | 43-6013 | $45,930 | 961,610 | 3.2% |
| Interviewers, except eligibility and loan | 43-4111 | $45,920 | 148,060 | 13.4% |
| Pharmacy technicians | 29-2052 | $45,750 | 471,680 | less than 0.5% |
| Medical assistants | 31-9092 | $45,690 | 817,870 | less than 0.5% |
| Shipping, receiving, and inventory clerks | 43-5071 | $45,260 | 816,870 | 0.6% |
| Phlebotomists | 31-9097 | $45,230 | 143,540 | less than 0.5% |
| Office clerks, general | 43-9061 | $45,010 | 2,464,940 | 10.6% |
| Light truck drivers | 53-3033 | $44,860 | 983,300 | less than 0.5% |
| Customer service representatives | 43-4051 | $44,770 | 2,595,750 | 38.9% |
| Library technicians | 25-4031 | $44,580 | 68,690 | less than 0.5% |
| Reservation and transportation ticket agents and travel clerks | 43-4181 | $44,390 | 118,710 | 12.8% |
| First-line supervisors of food preparation and serving workers | 35-1012 | $44,080 | 1,223,240 | less than 5% |
| File clerks | 43-4071 | $43,600 | 73,440 | 12.1% |
| Tellers | 43-3071 | $43,030 | 329,480 | less than 0.5% |
| Helpers--electricians | 47-3013 | $42,670 | 63,630 | less than 0.5% |
| Nursing assistants | 31-1131 | $42,260 | 1,448,910 | less than 0.5% |
| Residential advisors | 39-9041 | $42,240 | 84,760 | less than 5% |
| Substitute teachers, short-term | 25-3031 | $41,670 | 524,770 | less than 10% |
| Counter and rental clerks | 41-2021 | $41,300 | 400,810 | less than 0.5% |
| Machine feeders and offbearers | 53-7063 | $41,220 | 42,330 | less than 0.5% |
| Laborers and freight, stock, and material movers, hand | 53-7062 | $40,240 | 2,950,280 | less than 0.5% |
| Butchers and meat cutters | 51-3021 | $40,140 | 136,430 | less than 0.5% |
| Helpers--installation, maintenance, and repair workers | 49-9098 | $39,630 | 95,580 | less than 0.5% |
| Merchandise displayers and window trimmers | 27-1026 | $39,390 | 165,220 | less than 5% |
| Mail clerks and mail machine operators, except postal service | 43-9051 | $39,280 | 55,230 | less than 0.5% |
| Couriers and messengers | 43-5021 | $39,200 | 68,640 | less than 0.5% |
| Landscaping and groundskeeping workers | 37-3011 | $39,150 | 952,640 | less than 0.5% |
| Helpers--production workers | 51-9198 | $39,070 | 165,700 | less than 0.5% |
| Driver/sales workers | 53-3031 | $38,770 | 409,180 | less than 0.5% |
| Parts salespersons | 41-2022 | $38,630 | 270,070 | less than 0.5% |
| Switchboard operators, including answering service | 43-2011 | $38,630 | 34,280 | 13.2% |
| Meat, poultry, and fish cutters and trimmers | 51-3022 | $38,300 | 145,700 | less than 0.5% |
| Orderlies | 31-1132 | $38,290 | 52,440 | less than 0.5% |
| Veterinary assistants and laboratory animal caretakers | 31-9096 | $38,150 | 126,580 | less than 0.5% |
| Preschool teachers, except special education | 25-2011 | $38,140 | 478,780 | less than 0.5% |
| Crossing guards and flaggers | 33-9091 | $38,100 | 94,360 | less than 0.5% |
| Security guards | 33-9032 | $38,020 | 1,283,470 | less than 0.5% |
| Receptionists and information clerks | 43-4171 | $38,010 | 910,180 | 2.7% |
| Tire repairers and changers | 49-3093 | $37,710 | 108,410 | less than 0.5% |
| Cooks, institution and cafeteria | 35-2012 | $37,450 | 441,050 | less than 0.5% |
| Cooks, restaurant | 35-2014 | $37,390 | 1,409,890 | less than 0.5% |
| Stockers and order fillers | 53-7065 | $37,330 | 2,833,810 | less than 0.5% |
| Shuttle drivers and chauffeurs | 53-3053 | $37,290 | 248,530 | less than 0.5% |
| Bakers | 51-3011 | $37,160 | 236,200 | less than 0.5% |
| Baggage porters and bellhops | 39-6011 | $37,080 | 28,510 | less than 0.5% |
| Library assistants, clerical | 43-4121 | $36,910 | 85,520 | less than 0.5% |
| Janitors and cleaners, except maids and housekeeping cleaners | 37-2011 | $36,840 | 2,209,760 | less than 0.5% |
| Sewing machine operators | 51-6031 | $36,670 | 104,880 | less than 0.5% |
| Recreation workers | 39-9032 | $36,560 | 331,490 | less than 0.5% |
| Packers and packagers, hand | 53-7064 | $36,280 | 559,820 | less than 0.5% |
| Cooks, short order | 35-2015 | $35,880 | 138,650 | less than 0.5% |
| Cleaners of vehicles and equipment | 53-7061 | $35,830 | 380,430 | less than 0.5% |
| Automotive and watercraft service attendants | 53-6031 | $35,670 | 102,010 | less than 0.5% |
| Maids and housekeeping cleaners | 37-2012 | $35,510 | 860,670 | less than 0.5% |
| Retail salespersons | 41-2031 | $35,410 | 3,897,860 | less than 5% |
| Food servers, nonrestaurant | 35-3041 | $35,360 | 293,900 | less than 0.5% |
| Animal caretakers | 39-2021 | $35,360 | 266,910 | less than 0.5% |
| Food preparation workers | 35-2021 | $35,320 | 893,600 | less than 0.5% |
| Physical therapist aides | 31-2022 | $35,240 | 48,150 | less than 0.5% |
| Waiters and waitresses | 35-3031 | $35,230 | 2,270,910 | less than 0.5% |
| Parking attendants | 53-6021 | $35,150 | 137,880 | less than 0.5% |
| Hotel, motel, and resort desk clerks | 43-4081 | $35,070 | 261,420 | less than 0.5% |
| Childcare workers | 39-9011 | $34,980 | 518,910 | less than 0.5% |
| Laundry and dry-cleaning workers | 51-6011 | $34,890 | 198,040 | less than 0.5% |
| Dishwashers | 35-9021 | $34,810 | 477,450 | less than 0.5% |
| Bartenders | 35-3011 | $34,340 | 756,390 | less than 0.5% |
| Dining room and cafeteria attendants and bartender helpers | 35-9011 | $33,980 | 542,750 | less than 0.5% |
| Lifeguards, ski patrol, and other recreational protective service workers | 33-9092 | $33,580 | 157,550 | less than 0.5% |
| Ushers, lobby attendants, and ticket takers | 39-3031 | $32,910 | 121,770 | less than 0.5% |
| Cashiers | 41-2011 | $32,880 | 3,089,410 | less than 0.5% |
| Amusement and recreation attendants | 39-3091 | $32,150 | 397,830 | less than 0.5% |
| Fast food and counter workers | 35-3023 | $31,200 | 3,854,050 | less than 0.5% |
| Hosts and hostesses, restaurant, lounge, and coffee shop | 35-9031 | $31,200 | 432,690 | less than 0.5% |
| Cooks, fast food | 35-2011 | $30,890 | 641,070 | less than 0.5% |
How this analysis was built
Data
Population: every BLS detailed occupation with a published ORS 2025 telework estimate, a national OEWS May 2025 median annual wage and OEWS employment of at least 10,000 (208 occupations).
Telework is the ORS measure of whether workers in the occupation have the ability to telework. It describes what the job permits, not how many people actually work from home, which the Current Population Survey measures separately. The 2025 ORS estimates are preliminary.
Missing data: BLS publishes 125 of the 208 telework values only as ranges (for example less than 0.5%). For ranking they sit just below the published bound; a share is counted as below 5% only when it definitely is, and as unknown otherwise.
Sensitivity: placing every range at its bound, its midpoint or zero gives a rank correlation of 0.57 to 0.61. Using point estimates only (83 occupations) gives 0.33; that subset drops almost every low-paid occupation, so it is reported but not used as the headline.
Interval: 95% percentile bootstrap over occupations, 1,000 resamples with a fixed seed (15), so the interval reproduces exactly.
Matched pairs: two occupations with ORS point estimates whose national medians are within 3% of each other and whose telework shares differ by at least 50 percentage points.
| Bls ors detailed occupations | 226 |
|---|---|
| Excluded no published telework estimate | 8 |
| Excluded no oews national median | 10 |
| Excluded oews employment below 10000 | 0 |
| Analysed | 208 |
What a rank correlation means
Spearman's rank correlation compares the order of occupations on two measures. It runs from -1 to 1: 1 means the highest-paid occupation also has the highest telework share and so on down the list, 0 means no consistent ordering. A value around 0.6 is a clear but far from perfect pattern: many occupations break it, as the chart shows.
Limitations
- The 2025 ORS estimates are preliminary and can be revised.
- The ability to telework is not the share of workers who telework, and these figures are not remote jobs counts.
- Pay is the national median for wage and salary workers; it excludes the self-employed and says nothing about any one employer.
- This is an observational pattern across occupations. It does not identify why the pattern exists and does not describe any single job or person.
- Occupations with fewer than 10,000 jobs or without published estimates are not included.
Data dictionary
| Column | Type | Definition |
|---|---|---|
soc | str | 2018 SOC code (BLS detailed occupation) |
occupation | str | BLS occupation title |
oews_median_annual_wage_usd_may2025 | int | BLS OEWS national median annual wage, May 2025, U.S. dollars |
oews_employment_may2025 | int | BLS OEWS national employment, May 2025 (wage and salary workers) |
pay_band | str | TryHired pay band of the median annual wage |
ors_telework_published | str | Share of workers with the ability to telework, as published by BLS ORS 2025 (preliminary); '<x' = published only as less than x% |
ors_telework_estimate_type | str | point = a point estimate; upper_bound = BLS publishes only a range below the bound |
ors_telework_value_pct | float | The point estimate, or the published upper bound of the range |
ors_telework_rank_value | float | Value used to rank occupations: the point estimate, or 0.001 below the upper bound of a range (S015 rule) |
telework_below_5pct | str | yes / no / unknown: is the share definitely below 5%? |
telework_50pct_or_more | str | yes / no: is the share definitely 50% or more? (every published range is below 50%, so never unknown) |
Where every number comes from
Data
| Dataset | Publisher | Release | Reference period | License | Link |
|---|---|---|---|---|---|
| Occupational Employment and Wage Statistics (OEWS), national estimates | U.S. Bureau of Labor Statistics | May 2025 estimates | May 2025 | Public domain (U.S. federal government work) | www.bls.gov |
| Occupational Requirements Survey (ORS), 2025 estimates (preliminary) | U.S. Bureau of Labor Statistics | 2026-01-16 | 2025 (samples collected August 2023 to July 2025) | Public domain (U.S. federal government work) | www.bls.gov |
Reuse the data
One row per BLS detailed occupation (208 rows): OEWS May 2025 national median annual wage and employment, and the BLS ORS 2025 preliminary share of workers with the ability to telework, with the published range kept as text and the values TryHired used for ranking and counting.
- Data (CSV, 208 rows)
- Chart (SVG)
- Findings with reproduction specs (JSON)
- Source table (CSV)
- Media summary
TryHired, “Same pay, different telework ability: what BLS data shows for 208 occupations”, TryHired analysis of BLS ORS 2025 (preliminary) and OEWS May 2025 data, 2026. https://tryhired.co/careers/data/same-pay-different-telework/
Free to reuse with attribution to TryHired and the U.S. Bureau of Labor Statistics. Found an error? Report it through the corrections process; corrections are logged on the TryHired data hub.