Pay range within jobs: how far apart the top and bottom of the same job are paid
Inside the typical U.S. occupation, the 90th-percentile worker earns 2.25 times the 10th-percentile worker, and most of that range is present inside each state: the median occupation keeps 92% of its national pay range within a single state (BLS OEWS May 2025, 482 occupations).

What the data shows
Data Each finding is recomputed from the CSV below; values and method are in findings.json.
- Inside the typical U.S. occupation, workers at the 90th percentile of pay earn 2.25 times what workers at the 10th percentile earn: the median 90th-to-10th percentile ratio across 757 occupations (BLS OEWS May 2025, annual wages). For the middle half of occupations the ratio is 1.91 to 2.74.W-F1
- The widest ranges: Athletes and Sports Competitors (28.0 times), Orthopedic Surgeons, Except Pediatric (7.8) and Oral and Maxillofacial Surgeons (7.2). The narrowest: Postmasters and Mail Superintendents (1.31), Farmworkers and Laborers, Crop, Nursery, and Greenhouse (1.39) and Tellers (1.45).W-F2
- Most of that range is present inside each state. Across 482 occupations with reliable estimates in 10 or more states, the typical within-state 90th-to-10th percentile ratio is 2.04, against 2.20 nationally; the median occupation keeps 92% of its national pay range (on a log scale) inside a single state.W-F3
- In 296 of the 482 occupations, 90% or more of the national range is present within states. In 34, less than 75% is; the lowest shares are Home Health and Personal Care Aides (56%), Passenger Attendants (58%) and First-Line Supervisors of Correctional Officers (60%), where pay levels differ more from state to state.W-F4
- Higher-paying occupations tend to have wider pay ranges: the rank correlation between an occupation's median wage and its 90th-to-10th percentile ratio is 0.62 across the 757 occupations.W-F5
How to read the ratio: a 90th-to-10th percentile ratio of 2.25 means a worker at the 90th percentile of pay in that occupation earns 2.25 times what a worker at the 10th percentile earns. Percentiles describe the pay of current workers, not what any one worker will earn over a career.
How wide pay is, and how much of it is inside a state
Data Both charts have a table view and a downloadable SVG.
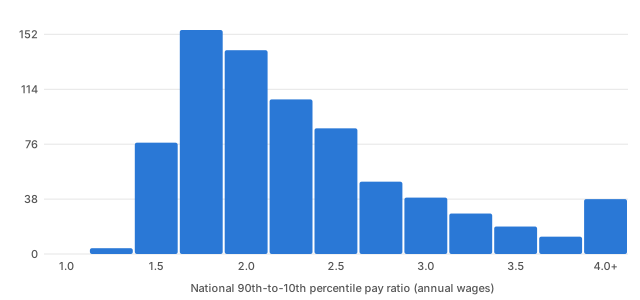
| National 90th-to-10th percentile ratio | Occupations |
|---|---|
| 1.00 to under 1.25 | 0 |
| 1.25 to under 1.50 | 4 |
| 1.50 to under 1.75 | 77 |
| 1.75 to under 2.00 | 155 |
| 2.00 to under 2.25 | 141 |
| 2.25 to under 2.50 | 107 |
| 2.50 to under 2.75 | 87 |
| 2.75 to under 3.00 | 50 |
| 3.00 to under 3.25 | 39 |
| 3.25 to under 3.50 | 28 |
| 3.50 to under 3.75 | 19 |
| 3.75 to under 4.00 | 12 |
| 4.00 or more | 38 |
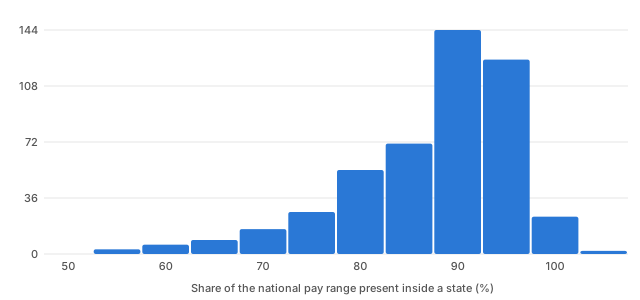
| Share within state | Occupations |
|---|---|
| 50% to under 55% | 0 |
| 55% to under 60% | 3 |
| 60% to under 65% | 6 |
| 65% to under 70% | 9 |
| 70% to under 75% | 16 |
| 75% to under 80% | 27 |
| 80% to under 85% | 54 |
| 85% to under 90% | 71 |
| 90% to under 95% | 144 |
| 95% to under 100% | 125 |
| 100% to under 105% | 24 |
| 105% to under 110% | 2 |
Widest and narrowest national ranges
| Occupation | 10th pct | Median | 90th pct | National ratio |
|---|---|---|---|---|
| Athletes and Sports Competitors | $26,500 | $66,710 | $742,310 | 28.01 |
| Orthopedic Surgeons, Except Pediatric | $84,170 | $358,550 | $659,290 | 7.83 |
| Oral and Maxillofacial Surgeons | $86,250 | $352,220 | $622,640 | 7.22 |
| Makeup Artists, Theatrical and Performance | $23,360 | $97,150 | $167,470 | 7.17 |
| Personal Financial Advisors | $50,190 | $105,070 | $357,020 | 7.11 |
| Chief Executives | $75,700 | $213,990 | $507,730 | 6.71 |
| Radiologists | $89,010 | $420,860 | $594,410 | 6.68 |
| Cardiologists | $107,190 | $496,010 | $712,130 | 6.64 |
| General Internal Medicine Physicians | $73,570 | $256,560 | $475,430 | 6.46 |
| Agents and Business Managers of Artists, Performers, and Athletes | $48,010 | $82,890 | $284,570 | 5.93 |
| Textile Winding, Twisting, and Drawing Out Machine Setters, Operators, and Tenders | $31,790 | $38,670 | $49,420 | 1.55 |
| School Bus Monitors | $28,130 | $35,100 | $43,250 | 1.54 |
| Slaughterers and Meat Packers | $33,340 | $40,130 | $51,090 | 1.53 |
| Nursing Assistants | $33,940 | $42,260 | $51,980 | 1.53 |
| Nuclear Power Reactor Operators | $98,640 | $122,890 | $149,310 | 1.51 |
| Graders and Sorters, Agricultural Products | $29,580 | $35,730 | $44,490 | 1.50 |
| Roof Bolters, Mining | $63,750 | $78,540 | $92,830 | 1.46 |
| Tellers | $34,360 | $43,030 | $49,680 | 1.45 |
| Farmworkers and Laborers, Crop, Nursery, and Greenhouse | $32,900 | $35,660 | $45,690 | 1.39 |
| Postmasters and Mail Superintendents | $85,090 | $96,660 | $111,740 | 1.31 |
Where states differ most
| Occupation | 10th pct | Median | 90th pct | National ratio | Within-state ratio | Share within state |
|---|---|---|---|---|---|---|
| Home Health and Personal Care Aides | $27,040 | $35,800 | $45,040 | 1.67 | 1.33 | 56% |
| Passenger Attendants | $27,970 | $37,720 | $46,590 | 1.67 | 1.35 | 58% |
| First-Line Supervisors of Correctional Officers | $52,330 | $77,970 | $127,780 | 2.44 | 1.71 | 60% |
| Fast Food and Counter Workers | $22,840 | $31,200 | $42,650 | 1.87 | 1.46 | 61% |
| Cooks, Fast Food | $22,580 | $30,890 | $42,910 | 1.90 | 1.48 | 61% |
| Pipelayers | $37,730 | $49,000 | $80,170 | 2.12 | 1.60 | 62% |
| Correctional Officers and Jailers | $42,760 | $58,940 | $93,220 | 2.18 | 1.63 | 63% |
| Gambling Change Persons and Booth Cashiers | $24,460 | $36,220 | $60,330 | 2.47 | 1.76 | 63% |
| Ushers, Lobby Attendants, and Ticket Takers | $23,560 | $32,910 | $42,470 | 1.80 | 1.45 | 63% |
| Bailiffs | $32,140 | $56,600 | $96,770 | 3.01 | 2.08 | 66% |
How this analysis was built
Data
Population: Q1 = 757 BLS detailed occupations with national annual P10 and P90 (excluding hourly-only occupations and 'All Other' groups). Q2 = 482 of them with 10+ reliable states and no top-coded state cell. Raw files re-read on every build: national (830 detailed occupations) and state (35,223 detailed state cells, 50 states and DC).
| Decision | What the study does | Why |
|---|---|---|
| Wage metric | Annual 10th and 90th percentile wages as published (A_PCT10, A_PCT90). Hourly-only occupations (no annual percentiles) are excluded, never annualized. | For occupations that are not annual-only, OEWS annual wages are hourly rates times 2,080 hours, so the ranges describe pay rates, not hours worked or yearly earnings. |
| State reliability | A state cell counts when it has 500+ jobs, employment PRSE ≤ 20% and mean-wage PRSE ≤ 10% (the frozen S011 thresholds) and numeric P10 and P90. 10+ such states per occupation. | Estimates for small state cells carry more error; BLS publishes no error measure for percentiles, so the mean-wage PRSE is used as a proxy (sensitivity: strict gate). |
| Top-coding | A '#' (top-coded) P10 or P90 is never a number. If any otherwise-reliable state has one, the occupation leaves Q2. National P90 cells top-coded: 0; state P90 cells: 98. | A censored top would understate the range in one direction only. |
| Within-state measure | exp(employment-weighted mean of ln(state P90 / state P10)) over the reliable states; share = ln(within-state ratio) / ln(national ratio). | Weighting by employment describes where the workers are; logs make ratios average correctly and give a share between 0 and 1 when the within-state range is narrower. |
| Exclusions | 'All Other' residual groups (a mix of jobs) are flagged and excluded from the headlines; tipped occupations are flagged and kept. Puerto Rico, Guam and the Virgin Islands are out of scope. | Sensitivity variants report how much each choice moves the result. |
| Language | Pattern only: the study describes how wide pay ranges are and where they sit; it does not say why. | OEWS is an employer survey; it cannot identify reasons. |
Sensitivity
The headline median share is 92.3%. Every variant stays within 3 percentage points; the build fails if one does not.
| Variant | Occupations | Median share |
|---|---|---|
| Headline: frozen reliability rule, 10+ states | 482 | 92.3% |
| Strict reliability gate | 321 | 92.6% |
| 5+ reliable states | 570 | 91.8% |
| 20+ reliable states | 384 | 92.8% |
| Including 'All Other' groups | 516 | 92.3% |
| Excluding tipped occupations | 472 | 92.4% |
Limitations
- Wages are nominal, May 2025, and not adjusted for prices or cost of living.
- OEWS covers wage and salary workers; it excludes the self-employed. Percentiles describe current workers, not career paths or job offers.
- Except for annual-only occupations, OEWS annual wages are hourly rates times 2,080 hours: they say nothing about part-time work, overtime or yearly earnings.
- Estimates carry error; BLS publishes no error measure for percentiles, so the reliability gate uses the mean-wage PRSE as a proxy.
- A within-state range can include differences between metro areas, employers, experience and job content inside the state; the study does not separate them.
- This is a description of a pattern. It does not identify why pay ranges are wide or narrow.
Data dictionary
| Column | Definition |
|---|---|
soc | 2018 SOC code (BLS detailed occupation) |
occupation | BLS occupation title |
employment_national | OEWS national employment, May 2025 |
annual_p10_usd | National 10th-percentile annual wage (A_PCT10), U.S. dollars, May 2025 |
annual_median_usd | National median annual wage (A_MEDIAN) |
annual_p90_usd | National 90th-percentile annual wage (A_PCT90) |
national_ratio_p90_p10 | annual_p90_usd / annual_p10_usd |
reliable_states | States (50 + DC) whose estimate passes the reliability rule with numeric P10 and P90 |
states_with_topcoded_p10_or_p90 | Otherwise-reliable states with a top-coded ('#') P10 or P90 (any > 0 removes the occupation from Q2) |
within_state_ratio_p90_p10 | exp(employment-weighted mean over reliable states of ln(state P90 / state P10)) |
share_of_national_range_within_state | ln(within-state ratio) / ln(national ratio) |
share_within_state_strict | Same share under the strict reliability gate (sensitivity) |
share_within_state_min5 | Same share with 5+ reliable states (sensitivity) |
share_within_state_min20 | Same share with 20+ reliable states (sensitivity) |
annual_only | BLS publishes annual wages only (ANNUAL = TRUE) |
hourly_only | BLS publishes hourly wages only (no annual percentiles) |
flag_all_other | 'All Other' residual group |
flag_tipped | Tips customary (reviewed list); OEWS wages include tips |
typical_entry_education | BLS Employment Projections 2025-35 typical entry-level education (context only) |
in_q1 | In the Q1 headline population |
in_q2 | In the Q2 headline population |
Where every number comes from
Data The exact files read by the build, with their SHA-256; the archive is the BLS download that contains the file.
| Dataset | Publisher | Reference period | File | SHA-256 of the file | License |
|---|---|---|---|---|---|
| Occupational Employment and Wage Statistics (OEWS), national estimates | U.S. Bureau of Labor Statistics | May 2025 | oesm25nat.zip → national_M2025_dl.xlsx | 852250997ceff9b721ff68f63e877d818f9c1ec8b1b69dd367958faedd5282b2 | Public domain |
| Occupational Employment and Wage Statistics (OEWS), state estimates | U.S. Bureau of Labor Statistics | May 2025 | oesm25st.zip → state_M2025_dl.xlsx | e9590ec791fd2941341631f84ee6445d3df931c1ad5776b80ea07c9f89fba95d | Public domain |
| Employment Projections 2025-35, typical entry-level education (context column only) | U.S. Bureau of Labor Statistics | 2025 | factory/data/ep.json (TryHired ingest of the BLS Employment Projections tables) | ed8f0381e5da696a8b246c40f974f9e853d17c797787b43798ed1b27f3cfab1e | Public domain |
Who made this and how it is checked
- Author: Maid Dizdarevic, TryHired. Analysis and methodology dated 2026-10-27; reference period May 2025; dataset version 2026-10-27+acf14c4b4621.
- Review: there was no human peer review. Every published number is recomputed from the raw BLS files by a separate automated verification script that shares no code with the build, and a fresh rebuild must reproduce every file byte for byte (repro.json).
- Corrections: email maid@tryhired.co or use the corrections process; corrections are logged on the TryHired data hub.
Reuse the data
- Data (CSV, 830 rows)
- Data (JSON)
- Data package
- Findings with values (JSON)
- National ratio chart (SVG)
- Within-state chart (SVG)
- Sources with file hashes (CSV)
- Reproduction record (JSON)
- Media summary
Dizdarevic, M. (TryHired), “Pay range within jobs”, TryHired analysis of BLS OEWS May 2025 national and state data, dataset version 2026-10-27+acf14c4b4621. https://tryhired.co/careers/data/pay-range-within-jobs/
TryHired's analysis table is licensed CC BY 4.0; BLS source data are public domain.